Home | CV | Publications | IJ Plugins | Contact
Image CorrelationJ
|
Authors: |
Gary Chinga Carrasco (gch@gcsca.net) |
|
Date: |
2005/01/03 First version. 2005/12/06 Added option to fix a slide on the Stack2 thus allowing the correlation between several images in Stack1 and one image in Stack2 if necessary. 2007/06/15 Added several new options: Correlate next slide: correlate successive images in a stack Correaltion map: Creates a map showing the differences between local areas. Correlation plot: Create a plot showing the correlation. Correlation arrays: Displays the images used for correlation analysis. 2008/06/22 Include the Increasing sequence option (v. 1o). |
|
Requires: |
ImageJ 1.38t or later |
|
Source: |
|
|
Installation: |
Download Image_CorrelationJ_1o.class to the plugins folder and restart ImageJ. |
| Acknowledgement | The plugin is described in the following paper
and can be used as reference: Chinga, G. and Syverud, K.: "Quantification of paper mass distributions within local picking areas". Nordic Pulp and Paper Res. J. 22(4): 441-446 (2007). |
|
Description: |
This plugin correlates two images or stacks.
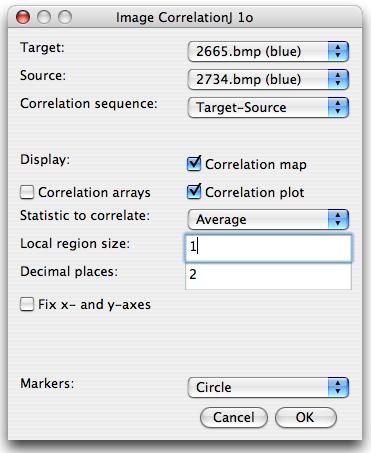
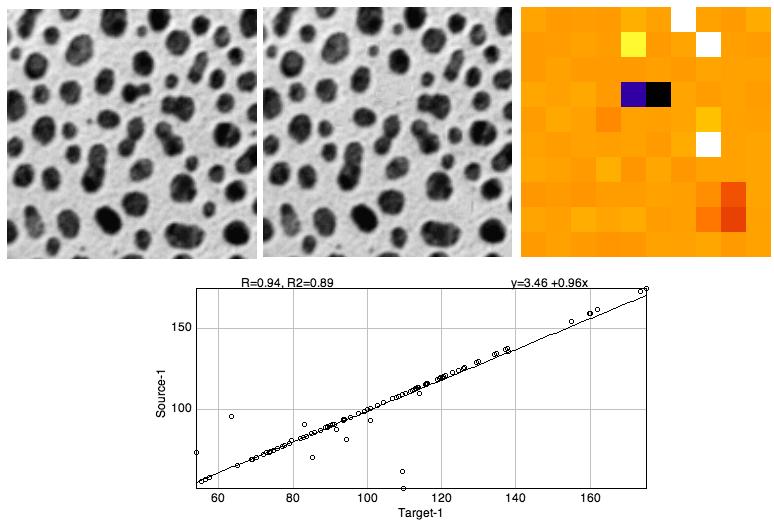
The plugin generates a scatter plot composed of the pixel values of Image1 (array1) and Image2 (array2) The statistics given are: - The correlation coefficient between Image1 and Image2 (R) - The slope of the regression line - The constant C intercepting the y-axis - The correlation can be performed based on single pixels or local areas. The local area size can be predefined. An average value is calculated for each local area and used for calculating the correlation coefficient. In addition, several statistics can be correlated, including: i) average, ii) std, iii) skewness, iv) kurtosis and v) directionality. The Correlation arrays also display the images that are used for correlation. Correlation sequence:Target-Source: correlates image n from Target image vs image n from Source image. Fix slide (Source): Fix the active slide on the Source stack and correlates it vs the slides in the Target stack. Next slide: correlates successive images in a stack, i.e. slide n vs slide n+1. Increasing sequece:
correlates
slides in a stack increasing the distance between the slides. A
correlation value R is calculated for each increament, i.e. : Correaltion map: creates a map showing the differenes between local areas. Correlation plot: Create a plot showing the correlation. - A 100 x100 pixels image yields an array of 10000 scatter plot values when defining a 1-pixel local area and 100 scatter plot values when defining a 10-pixels local area. - The max local area size is half the shortest image dimension (width or height): The user can change the size of the plot window using Edit>Options>Profile Plot Options. Width=520 and height 250 is recommended. Works with stacks. |
Last update June 19, 2007 | Copyrights (c) GCH